This portal provides access to an extensive and growing database of human phosphorylation sites (>100,000) and corresponding phosphopeptides that have been observed across hundreds of mass spectrometry-based phosphoproteomics discovery experiments. In addition to cataloging these sites we provide a tool for the design and implementation of targeted phosphoproteomic assays. You can mix-and-match phosphosites from pre-assembled lists, individually select the sites you are interested in, and/or upload a list of phosphosites. By adding retention time calibration data from a sample run on your LC-MS/MS system, you can automatically schedule and optimize your targeted assay. Using this method, highly precise and sensitive assays to screen hundreds of phosphopeptide targets can be developed rapidly.
For more information please refer to the publication:
Robert T. Lawrence, Brian C. Searle, Ariadna Llovet, Judit Villén. Plug-and-play analysis of the human phosphoproteome by targeted high-resolution mass spectrometry. Nature Methods. 2016.
Note:
click for more information anywhere this icon appears on the website.
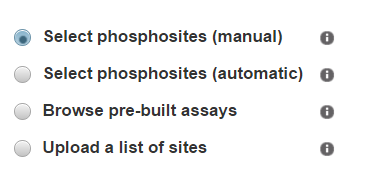
Several different mechanisms are provided for adding phosphorylation sites to an assay. They can be used in combination to rapidly generate a highly customized experiment.
For each option, select the digestion configuration used in the experiment (LysC/Trypsin or Trypsin) to automatically choose as default the most frequently observed peptide cleavage state for that scheme. In most cases these will be the same, but miscleavage events are enriched around acidic residues, sequential cleavage sites, and phosphorylated serine/threonine.

i) Select phosphosites (manual)
This is the most detailed and flexible option for assay design. It allows for manual selection of each phosphopeptide sequence and charge state to be measured and direct inspection of representative MS/MS spectra. It is the best way to directly evaluate data supporting an individual phosphorylation site. Targeting multiple sequences and charge states provides the best chances of detecting the site.
-
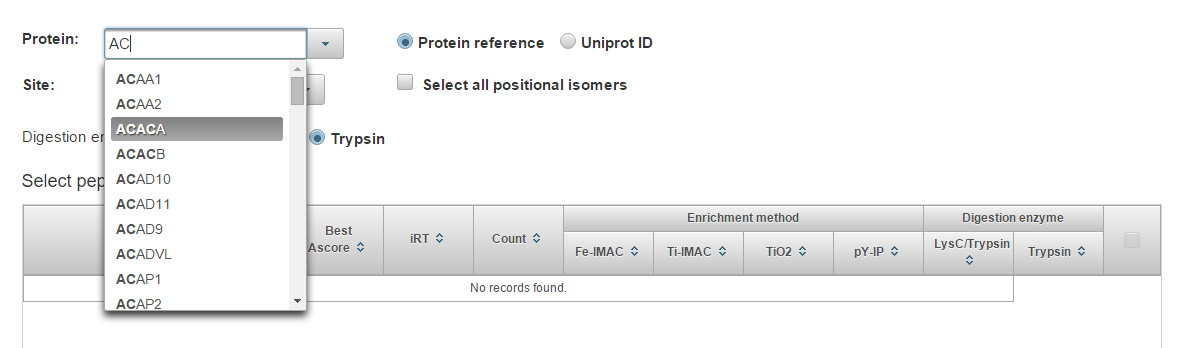
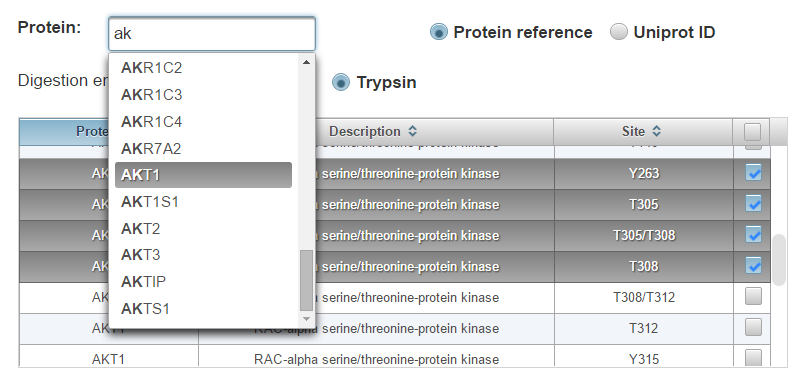
Start typing a protein identifier (HGNC gene symbol or Uniprot/Swiss-Prot accession are supported) and choose from the drop-down list.
-
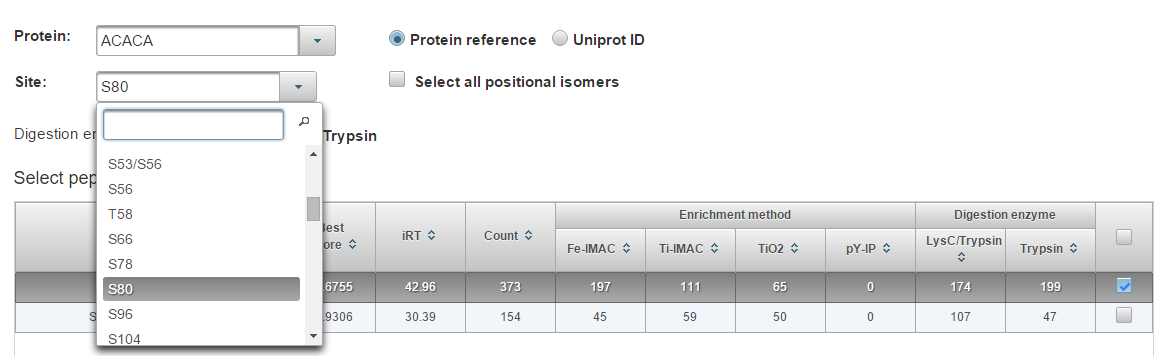
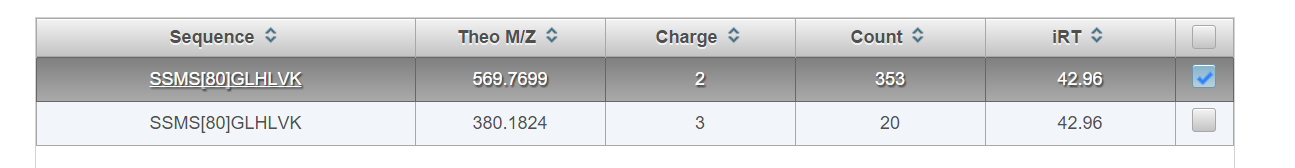
Select the site (position) on the protein. All peptide species that have been observed for this phosphosite will populate the table. Check the box next to the peptide(s) you would like to add or select all using the box in the top right. The most frequently observed sequence is selected by default. Choose “Select all positional isomers” to automatically schedule other known phosphosites that are localized to the same peptide (e.g. THFPQFS[80]YSASIRE and THFPQFSYSAS[80]IRE).
-
Choose “Select Peptides”. A list of precursor ions that have been observed for each peptide should appear.

-
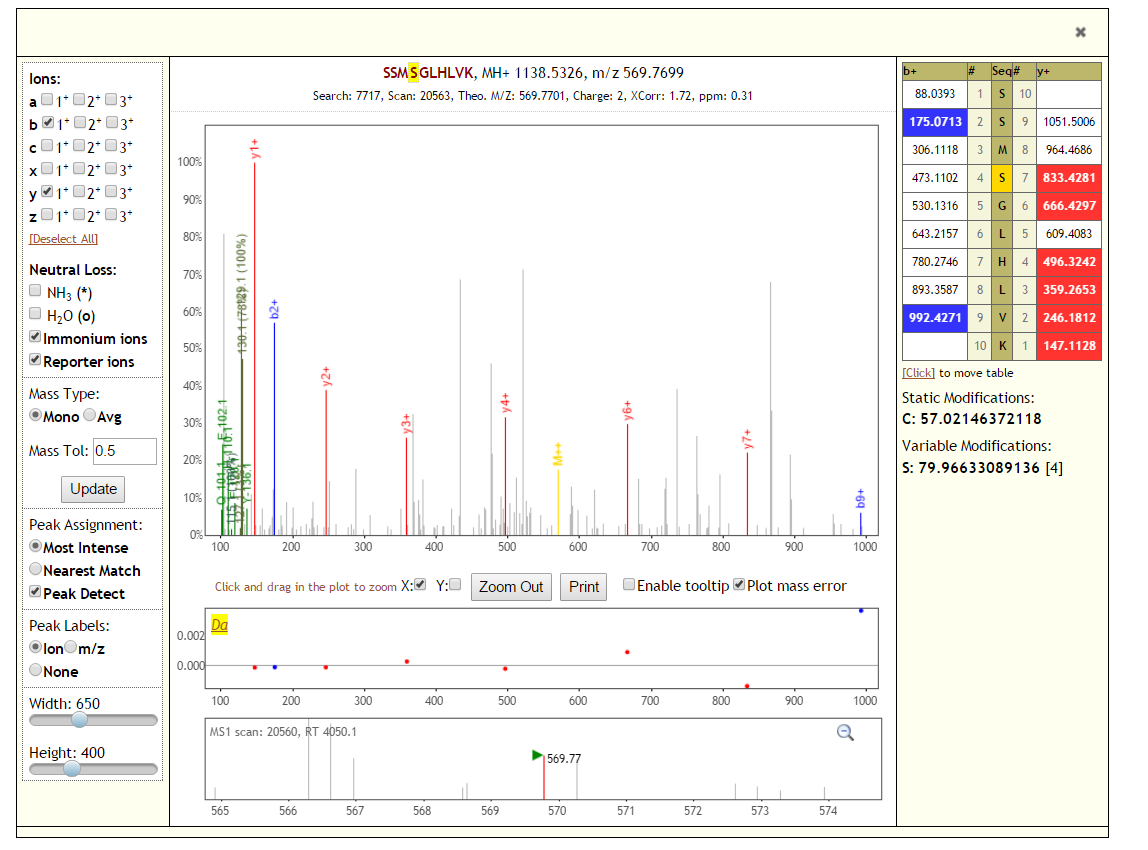
Click on the peptide sequence to see its MS/MS spectrum.
MS/MS spectra are visualized using Lorikeet (http://uwpr.github.io/Lorikeet/)
-
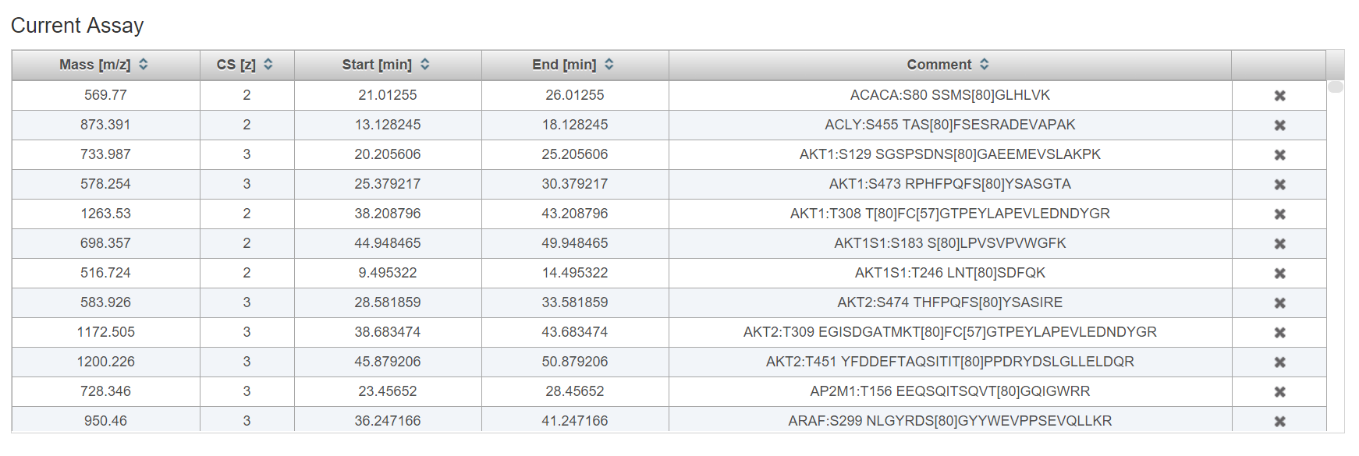
Check the box next to the precursor you would like to add or top right box to select all. The most frequently observed charge state is selected by default. Click “Add selected peptides”. The selected phosphopeptide precursor ions will be added to the current assay schedule which can be visualized at the bottom of the page (See section entitled “Assay Refinement”)

-
Repeat steps 1-5 to add more targets.
ii) Select phosphosites (automatic)
This option is similar as above, but precursor selection is performed automatically. It is the fastest way to browse the database to add individual phosphosites to an assay.
-
Start typing a protein identifier (HGNC gene symbol or Uniprot/Swiss-Prot accession are supported) and choose from the drop-down list. All phosphorylation site isoforms that have been observed on the protein will populate the table.
-
Check the boxes next to the phosphorylation sites you would like to add to the current assay or the top right box to select all.
-
Click “Add Selected Sites”. The most frequently observed peptide sequence and charge state will be automatically added to the current assay schedule which can be visualized at the bottom of the page (See section entitled “Assay refinement”)

iii) Browse pre-built assays
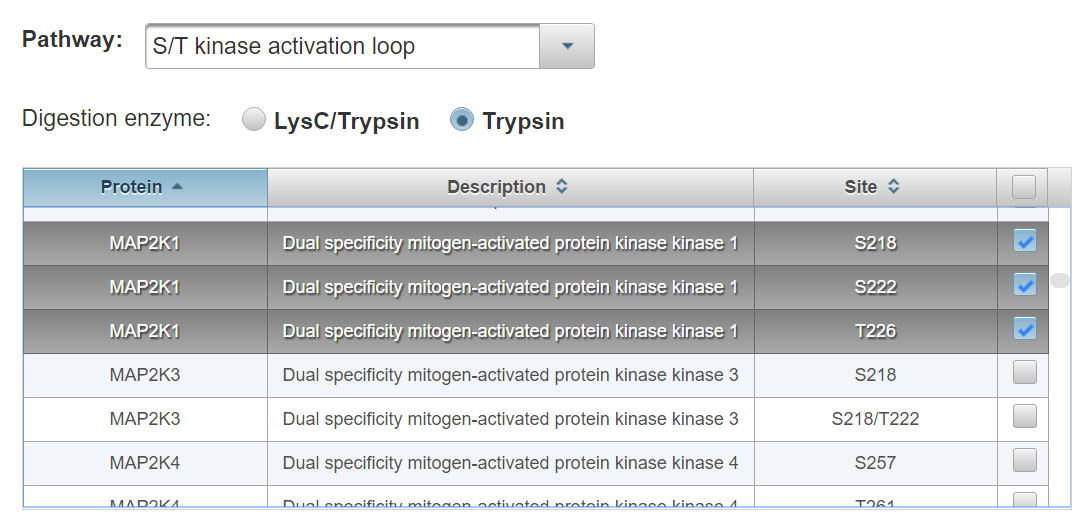
This option provides a menu of pre-built lists of phosphorylation sites curated from phosphospecific antibody catalogs, pathway diagrams, or derived on the basis of protein structural features. It is the easiest way to assemble a large assay containing phosphosites of known function. These lists are provided as a starting point to simplify assay design. They are not comprehensive nor are they necessarily generalizable to the unique signaling biology of specific human cell types.
-
Select a pathway from the drop-down menu. Check the boxes next to the phosphorylation sites you would like to add to the current assay or top right box to select all.
-
Click “Add Selected Sites”. The most frequently observed peptide sequence and charge state will be automatically added to the current assay schedule which can be visualized at the bottom of the page (See section entitled “Assay Refinement”)

-
Add more phosphosites from other pathways and proteins to create a customized assay for your experiment.
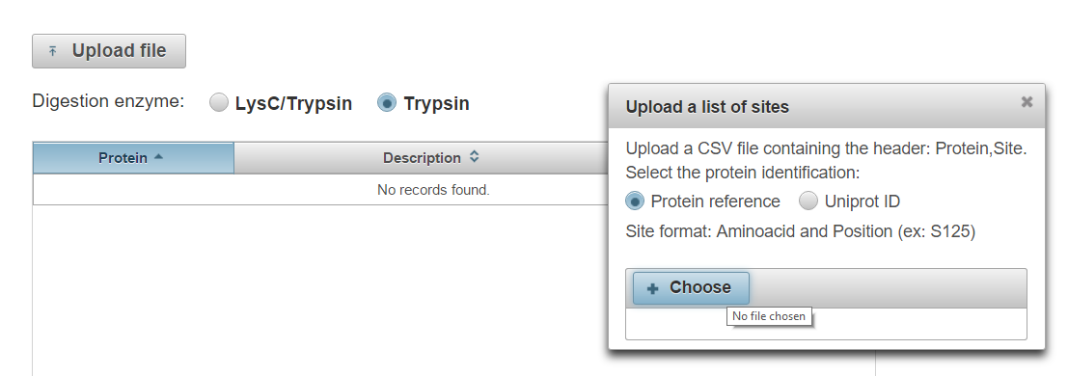
iv) Upload a list of sites
This option allows you to upload a custom list of phosphorylation sites for automatic precursor selection. It is the fastest way to generate a large assay for example to validate or expand on results from discovery experiments.
-
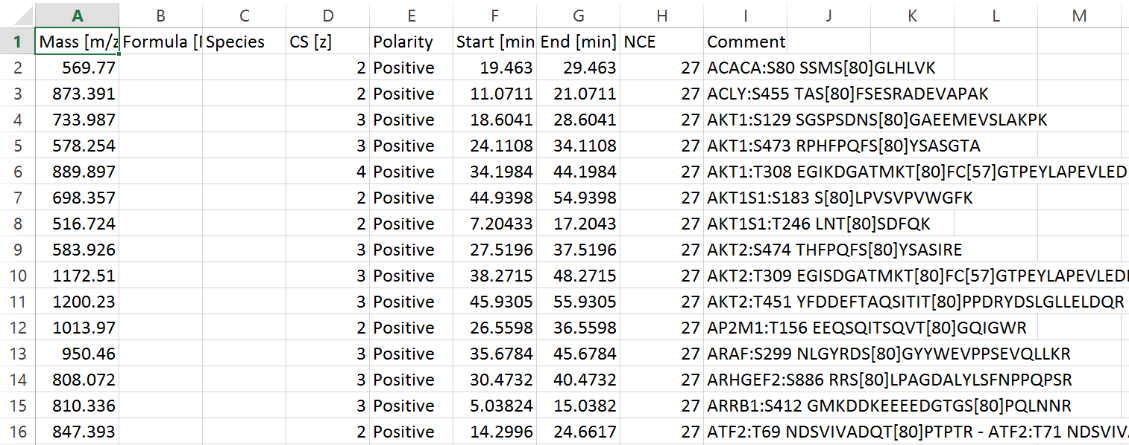
Click “Upload file” to generate a dialog for .csv file upload. The file must be in the format shown below, using HGNC gene symbols or Uniprot ID.
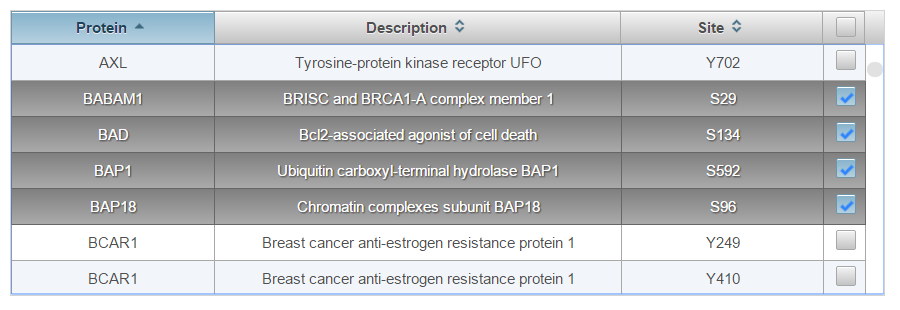
-
Check the boxes next to the phosphorylation sites you would like to add to the current assay or the top right box to select all.
-
Click “Add Selected Sites”. The most frequently observed peptide sequence and charge state will be automatically added to the current assay schedule which can be visualized at the bottom of the page (See section entitled “Refine assay”)

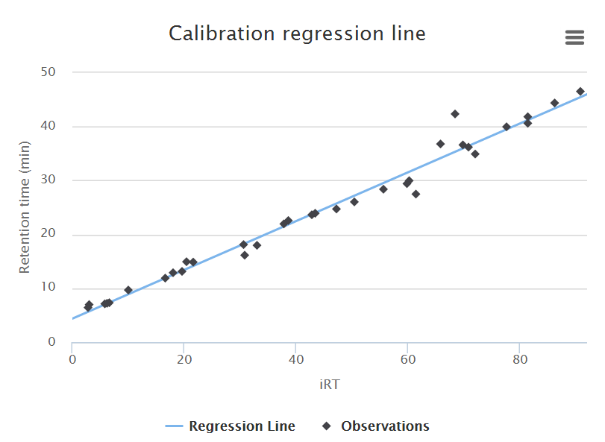
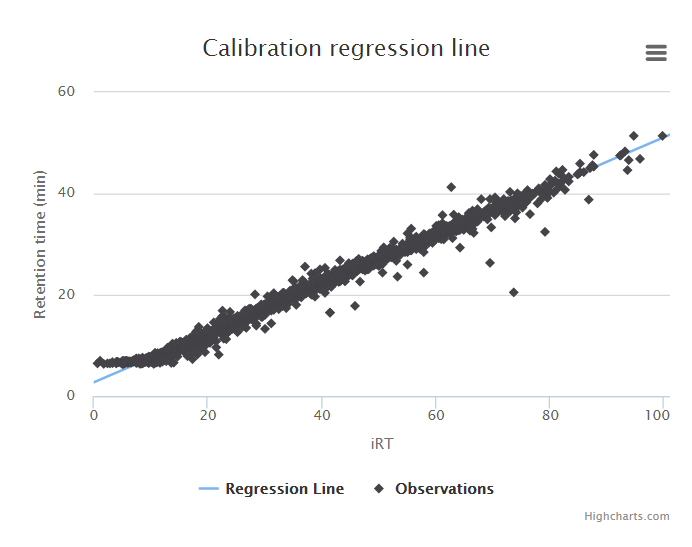
Retention times in the database are stored as iRT values, a dimensionless unit of relative hydrophobicity. For accurate retention time scheduling the assay must first be calibrated by analyzing a set of peptides measured using the same liquid chromatography configuration to be used for the experiment (i.e. the same pre-column, column, gradient, and flow rate).
For more information:
Escher C, Reiter L, MacLean B, Ossola R, Herzog F, Chilton J, MacCoss MJ, Rinner O. Using iRT, a normalized retention time for more targeted measurement of peptides. Proteomics. 2012.
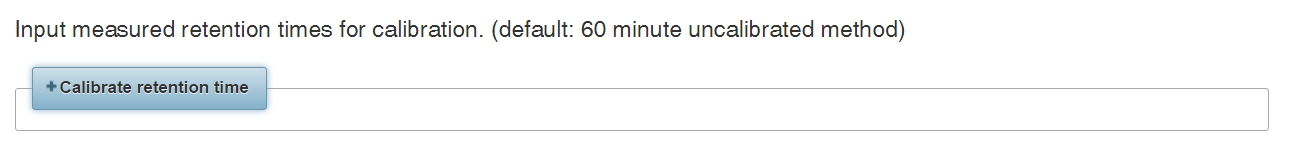
Click the “Calibrate retention time” button to expand the RT calibration panel.
Currently there are three options for retention time calibration. Using more calibration points enables more accurate prediction. We achieved the greatest accuracy by using data-dependent acquisition (DDA) to measure a complex mixture of human phosphopeptides.
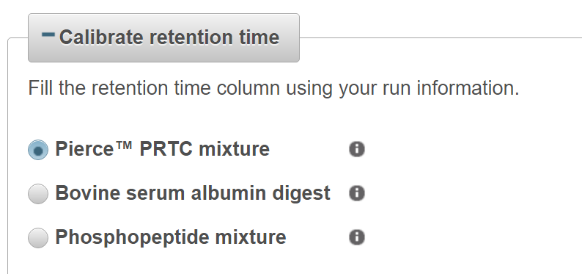
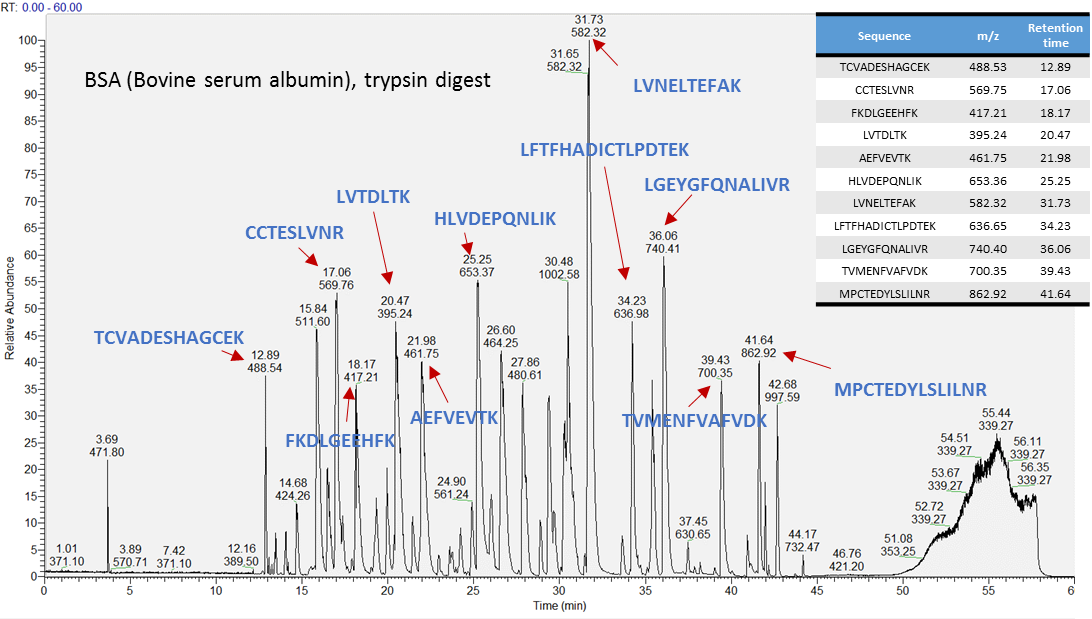
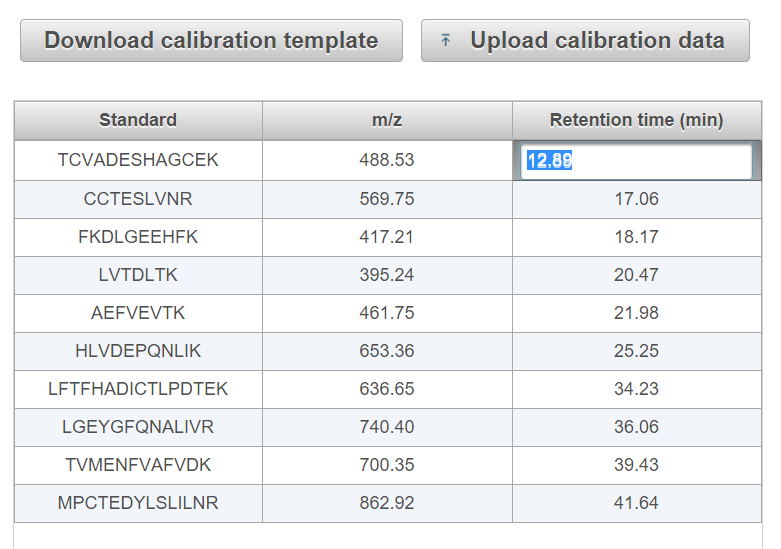
ii) Bovine serum albumin (BSA) digest
-
Prepare a BSA peptide standard by digesting BSA protein using trypsin. Analyze the BSA peptide mixture using your LC-MS/MS system. Some representative peptides are illustrated below, but more than 100 BSA-derived peptides are included in the retention time database. For this reason we recommend analyzing the sample using DDA to identify as many peptides as possible.
-
Enter the empirical retention times of each peptide directly in the table as below (not recommended) OR download the template .csv file and upload a complete list of BSA peptides identified using DDA (recommended).
-
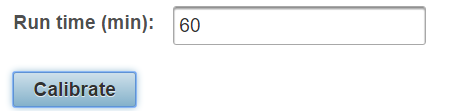
Enter the total length of the method in minutes in the box labeled “Run time” and click “Calibrate”. The retention times of the current assay will be updated automatically.
iii) Phosphopeptide mixture (human)
-
Prepare an aliquot of phosphopeptides from a sample you will be using for your experiment or prepare a human phosphopeptide sample similar to those to be analyzed in your experiment (e.g. use a HeLa lysate if your experiment is performed in HeLa cells). Analyze by DDA using your LC-MS/MS system.
-
Upload the peptide sequences and retention times using the template provided.

-
Enter the total length of the method in minutes in the box labeled “Run time” and click “Calibrate”. The retention times of the current assay will be updated automatically.
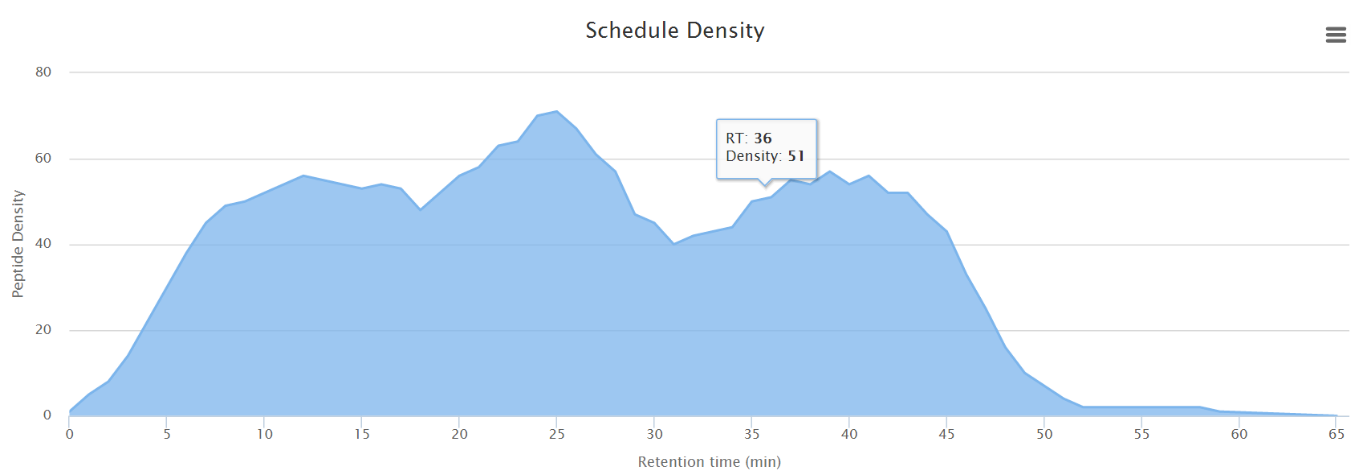
Once you have calibrated retention times you are ready to optimize your assay for export. The number of targets you can measure concurrently depends on the scanning rate of the mass spectrometer, chromatographic peak width, and the desired number of points along the curve. For example, if the peak-width is 20 seconds and you would like to measure 10 points, then the maximum duty cycle is 2 seconds. If the mass spectrometer scans at a rate of 10 Hz, it is feasible to measure up to 20 targets every 2 seconds.
Recommended strategy: screen, optimize, deploy
By using wide retention time windows and a lower peak sampling rate, it is feasible to screen several hundred targets simultaneously. Use a "screening" approach to empirically pinpoint retention times and exclude targets that cannot be detected. Then, narrow the window enough to accommodate intraday chromatographic variability (typically <30s in a 60min method) and increase the maximum injection time to boost sensitivity until the desired duty cycle is reached. The assay is ready to deploy.
The UWPR provides a helpful overview of some considerations for targeted assay design:
https://proteomicsresource.washington.edu/protocols05/PRM.php
Using the portal:
-
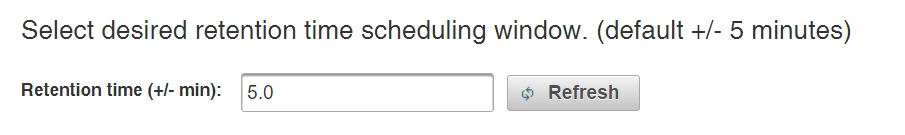
Enter the desired retention time tolerance window in the box. This represents the length of time before and after the predicted retention time to monitor for each phosphopeptide. The default tolerance is +/- 5 minutes, which was sufficient to capture >99% of targets using DDA analysis of a phosphopeptide mixture for calibration. Click refresh to update the schedule density plot.
-
[Optional] Continue to add or remove phosphopeptide precursors to reach the desired number of concurrent precursors (precursor density). Click the (x) next to a peptide to remove it from the assay.
-
Click “Upload schedule” to upload an assay previously generated using this tool. This is helpful for adding new targets and recalibrating the retention times of old assays.

-
Click “Merge positional isomers” (e.g. THFPQFS[80]YSASIRE and THFPQFSYSAS[80]IRE) to merge peptides with the same precursor m/z. Since these precursors often have overlapping windows, this eliminates redundant sampling.

Two options are provided for exporting the current assay.
-
Click “Export schedule” to download the current assay schedule above.

-
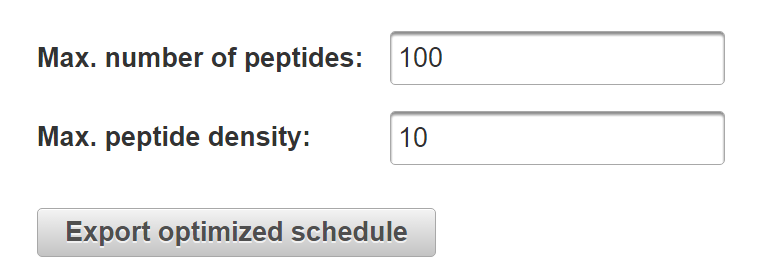
Enter the maximum number of precursors and maximum precursor density as desired. Click “Export optimized schedule” to automatically divide the assay into multiple runs.
-
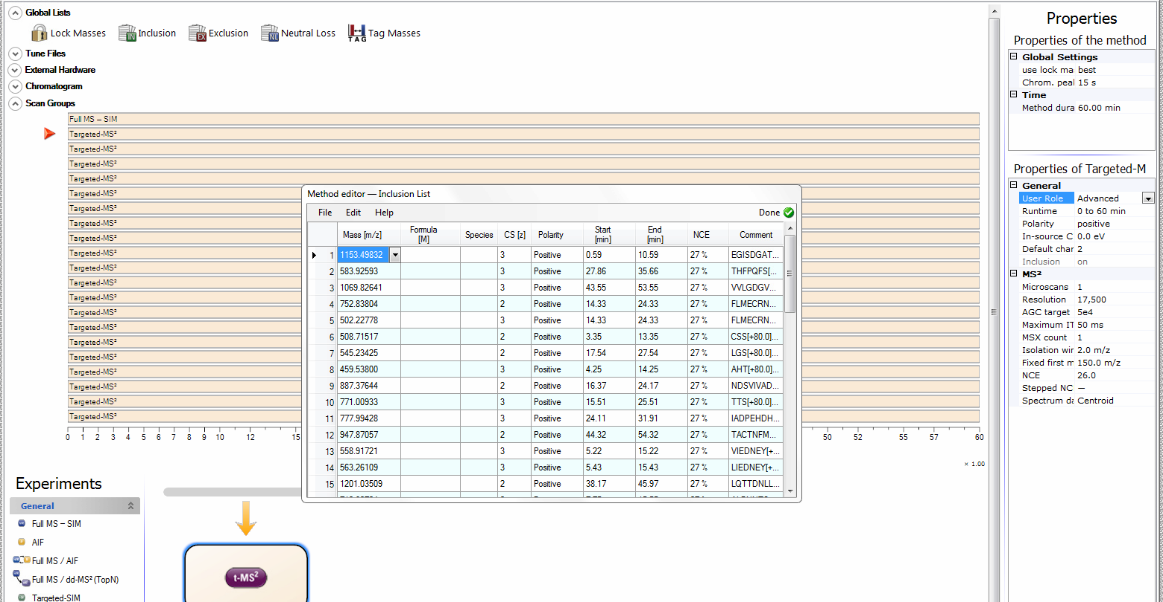
The exported schedule is a csv file directly compatible with Thermo Q-Exactive mass spectrometers and can be modified to work with virtually any platform.
-
To import the assay into a Thermo Q-Exactive method, click “Global Lists”-> “Inclusion” -> “File” -> “Import”